

AMZN & GOOGL long
AMZN & GOOGL long

It is 6/23/2024!! We just had the monthly June options expiration on Friday. For the last 3 days NVDA traded more options than SPX. And NVDA and SPY options together accounted for 30% of the options volume of the day. Hence I wrote a couple of posts with the title NVDA is the market. So does this continue now that the June options expiration is done? My answer is NO. I can say for sure that this coming week, we will not have NVDA trade more options than SPX. The final week of June which brings about the end of Q2, is usually weak. We have narrow breadth and participation from other stocks 495 stocks of S&P500. Only the AI-tech plays like NVDA, MSFT, AAPL, GOOGL and META have been rallying and holding the market. With the support that the monthly options expiration usually provide gone, we are most likely going to see some consolidation or down move in S&P and Nasdaq.
Lets go through with the weekly analysis of the indices.
Disclaimer: This is my trading plan on the indices. This is intended to be for educational and informational purposes only. Trading is risky and loss of capital is possible. Do your due diligence. In trading, there are no guarantees. So please be careful risking capital.
Index Income Trades from Archnatrades is a reader-supported publication. To receive new posts and support my work, consider becoming a free or paid subscriber.
Now check the sectors and Mag-7 analysis:
Why do I look at the sectors weekly?
If the sector is bullish and a stock from that sector has a good long setup then the stock is going in the same direction as the sector in general. This creates a more favorable outcome. Ultimately, trading in the stock market is a game of probablitites. If the stock is bullish but the entire sector is in a downtrend then the chances of the stock going higher or remaining higher becomes dicey.
Hence, I look at the sector ETF’s weekly. It becomes easier to focus on the best stock setups.
XLK: The techology sector ETF looks similar to QQQ. with a gravestone Doji outside the BB. This should in bring the price lower.
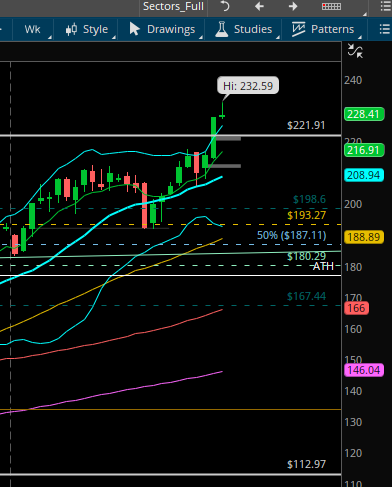
The 3 biggest holdings of XLK are NVDA, AAPL, MSFT. The only uber bullish chart from the three is MSFT. AAPL and NVDA look like they could use some rest.
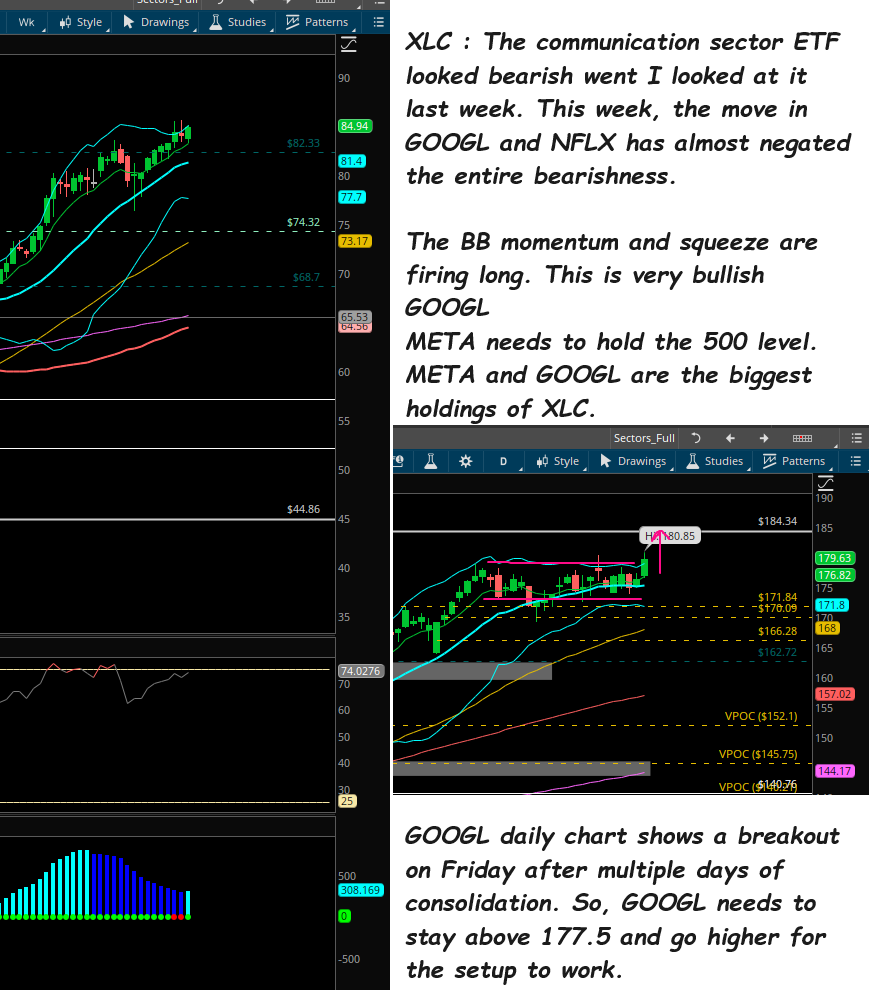
XLC:
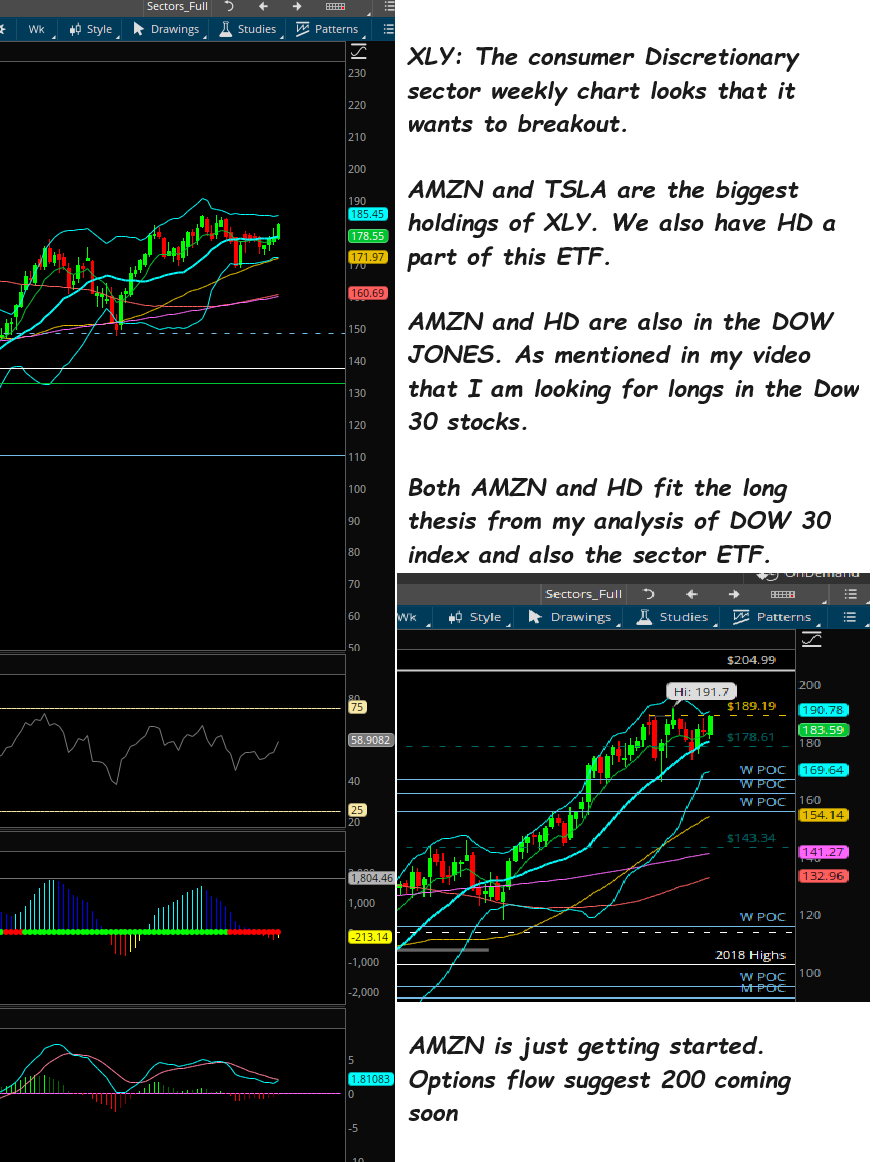
XLY:
Now Lets do Mag-7 analysis:
Disclaimer: This is my trading plan on the indices. This is intended to be for educational and informational purposes only. Trading is risky and loss of capital is possible. Do your due diligence. In trading, there are no guarantees. So please be careful risking capital.
Index Income Trades from Archnatrades is a reader-supported publication. To receive new posts and support my work, consider becoming a free or paid subscriber.