

FOMC & NFP week

Everything changes in a week!! Right!!
On April 14th I was writing about SPY closing at 495.16 and today in 1 week we are at SPY 508.26. What happened?
The charts in hindsight make it very easy to see why we bounced the way we bounced. The more important part is if we were able to anticipate it and position in manner which was beneficial to the account.
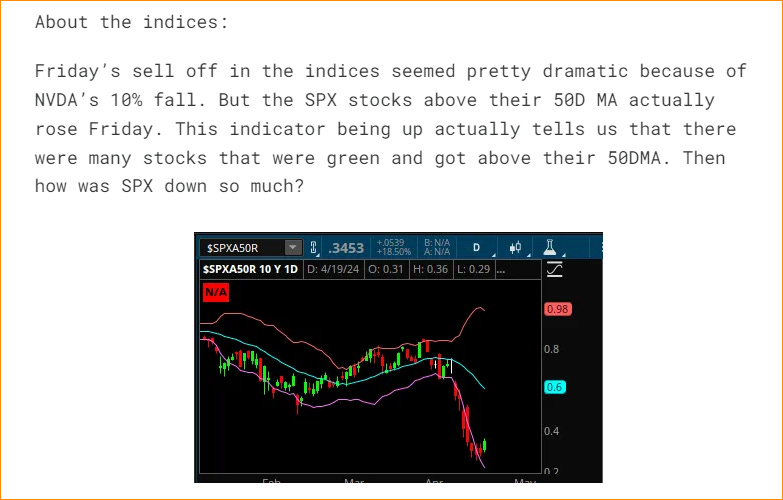
The below image shows part of the post that shows that I had mentioned that the sell off seemed scary because NVDA was down 10% in 1 day itself but there were more stocks that were green on Friday. Hence they were indicating a possible bounce this past week.
I had also as a mid-week update posted bullish IGV trade call calendar trade idea before MSFT and GOOGL earnings.
The IGV call calendar is up almost 40% and I am still in the trade.
But was the bounce this past week all but certain? Was there no risk for downside. And was there a way to know and prepare for it?
Here too I had listed the expected move that was priced in for the week. And how the downside expected move and the fib retracements formed a confluence that could serve as support. I had also mentioned that If we got to the 485-486 level, I would be a buyer and get long.
So, I had listed both the possibilites along with a mid week update. Being prepared and understanding levels in both directions helps us to react and take advantage and position according to the move that is happening.
The bounce was not the surprise but the size of the bounce was definitely was a surprise. The expected move to the upside was 504.78 on SPY. We closed at 508.36. 4 points higher in SPY is almost 40 points higher in SPX. We did this upside move before the big tech earnings came out. META brought SPY back within expected move but MSFT and GOOGL beat earnings and we were back above the expected move.
So, now about this coming week? This week we have a lot macro data including FOMC meeting, Treasury QRA funding announcement. We also have monhtly jobs number and AMZN and AAPL earnings. We also semis like QCOM, AMD reporting.
With so many data points that can affect the markets, and also the fact that we are not at SPX 4950 anymore, this week is a bit more tricky.
SPY : 513.34 is the monthly POC and my target for now. This level would correspond to SPX 5150.
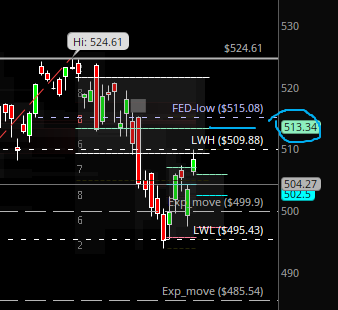
For SPY to get above this level after FOMC, may be difficult. If FED is dovish then we may have a chance to break above SPX 5150.
TLT: The chart of TLT is very concerning for equity bulls. There is no indication that TLT wants to bounce. There was also a huge bearish flow in TLT.
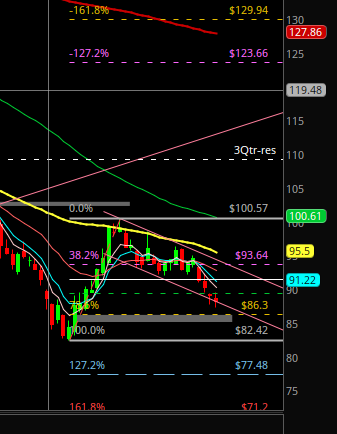
So, the way I am thinking and planning to position myself is that I need to hedge. I am looking to buy put butterfly and put debit spreads with end of May expiration with any spike in SPY close to 513-515 level.
Disclaimer: This is my trading plan on the indices. This is intended to be for educational and informational purposes only. Trading is risky and loss of capital is possible. Do your due diligence. In trading, there are no guarantees. So please be careful risking capital.
QQQ: A possible path for Q’s is that we can get to 440 level this week and then we have a pullback in the equity markets.
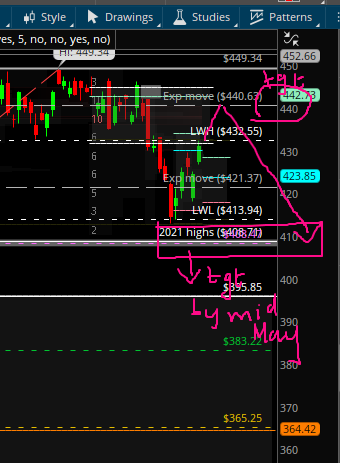
And by mid May we can get to 408 level in the Q’s.
A close over 446 in the Q’s will negate any short thesis. If FED says anything is remotely that is considered dovish then the market can rally. And hence I am repeating myself, if QQQ close above 436 then the entire bearish thesis and we going to 408 in Q’s is negated.
A small analysis below is a way for me to articulate my plan for this week. It also contains 2 - 3 earnings trade ideas for the coming week.
Disclaimer: This is my trading plan on the indices. This is intended to be for educational and informational purposes only. Trading is risky and loss of capital is possible. Do your due diligence. In trading, there are no guarantees. So please be careful risking capital.