

I am back!!

I would like to thank all my readers for being patient and supportive while I took a vacation for 3 weeks to go visit my Mom in India.
I was away from markets and screens for 3 weeks. It was hard but I did it. So, today when I am looking at the charts, I am looking at the charts fresh with no bias.
So, let’s get started:
Let’s get to the Dollar index first:

Above is the weekly chart of the dollar index. Since the dollar index is more of a macro indicator, it is better to look at weekly charts.
The grey rectangle box is from 100.66 to 105.95. With the kind of return we have had this year, as long as the dollar is within this box, I think it does not matter much to the equity markets. Something drastic has to change for the dollar to be above 106 and below 100. Hence the daily moves of the dollar index are less important for me.
Before I go to the indices and sector ETFs, we had FOMC meeting this past week and hence it makes sense to first look at TLT before the equity indices.
TLT:
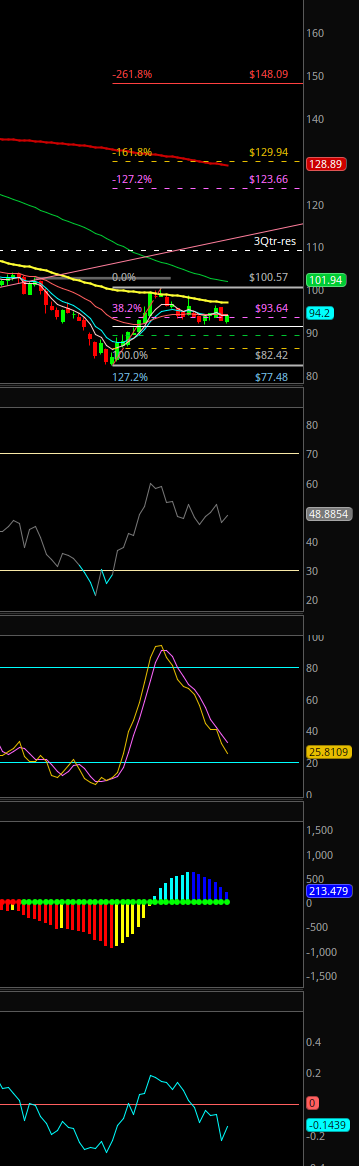
Let us objectively analyze the chart. The 55 WK (yellow line) and 100 WK (green line) moving averages are pushing the price down but the price is still above the 50% fib retracement level of 91.5
The RSI is neutral, the next indicator on my chart is the StochasticSlow. It is pointed down. The TTM Squeeze indicator also shows fading upward movement. The bottommost indicator on my chart is the ChaikinMoneyFlow indicator. The setting for this is 13 period. This shows that even though the price has not gone below the 50% retracement, the money flow is leaving and is below 0 and has been below 0. So, the chart suggests that we test lower levels. We could test the 50% retracement level at 91.5 or even below 89.4 which is the 61.8% fib retracement.
On the daily chart: TLT has to get above 95.18 to get inside the yearly value area. Also, we are in a clear downtrend channel on the daily chart. We need to break above this channel for higher prices.
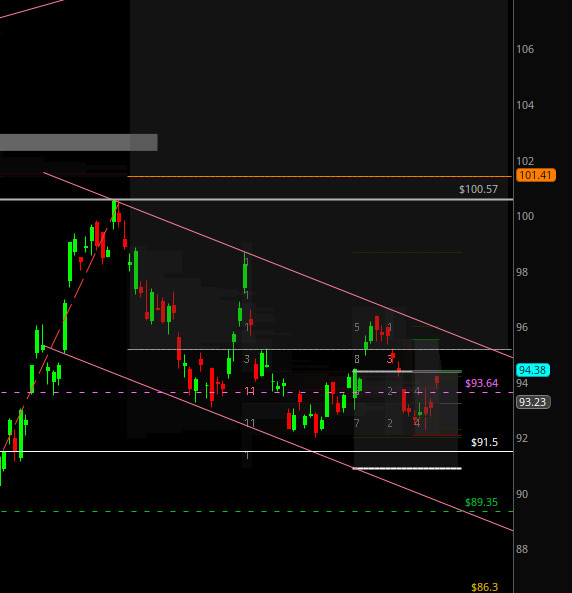
If that happens then we are looking at lower rates. Until TLT has a weekly close above 95.18, I am not looking for a swing-long trade in TLT.
But as long as we are not below 90-91.5 in TLT, I do not think the bull momentum in the indices can be affected.
Now let’s get to the indices:
Disclaimer: This is my trading plan on the indices. This is intended to be for educational and informational purposes only. Trading is risky and loss of capital is possible. Do your due diligence. In trading, there are no guarantees. So please be careful risking capital.
SPY:
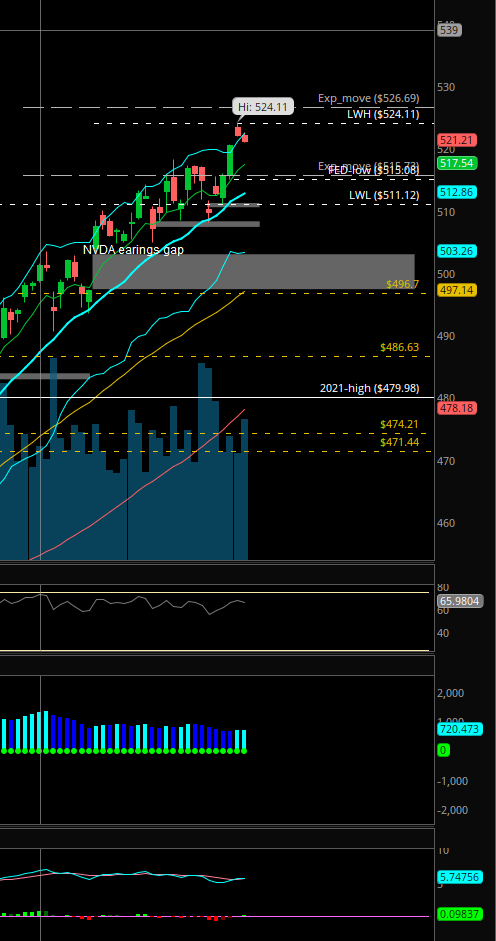
The daily chart of SPY shows that the day after FOMC we gapped up and could not hold the gap up and faded. We have still not filled the gap. There has been an RSI bearish divergence for a while. The other indicators are in the bullish range and have not rolled over. So, even though we have had 2 red days, there is nothing bearish that stands out in the daily chart.
Based on the options expected move on this coming shortened trading week is 5.48 points on the SPY. The downside of this expected move and the FED day low both nearly coincide.
This Thursday is the quarterly expiration and hence there is a lot of open interest in puts at lower levels. The 2nd highest OI for the quarterly expiration is 515 on the SPY. The weekly POC is at 516.37. So if SPY goes for the gap fill from the FED day high which is at 520.62 and bounces then it is fine. But if we continue going lower then the OI at 515 and POC at 516.37 is in play.
I will be looking for that setup on SPY. If this setup plays out then I will buy Puts and participate in the downside to 516.37 to 515 level in the SPY. I am not looking to trade on the upside.
QQQ: The Q’s look a bit different than the SPY.
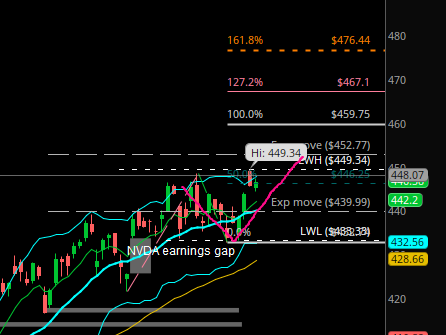
Above is the daily chart of Q’s. Q’s from 3/8th onwards had a pullback to 433 level. This is the top of the NVDA earnings gap up. So, in theory, Q’s popped on NVDA’s earnings and got to 448.64, pulled back to the top of the gap day and then bounced. So as long as we are above 442, I am looking to buy the dip in Q’s
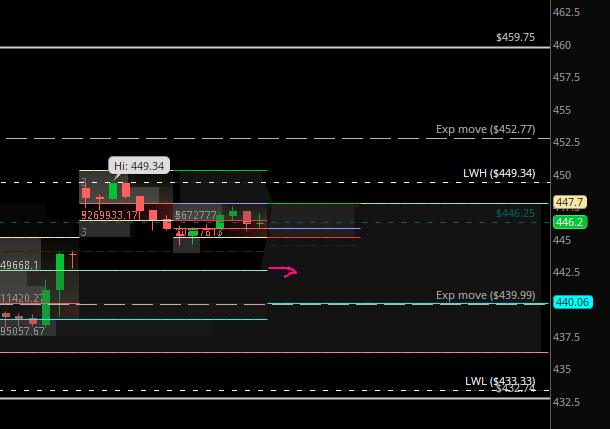
If I take a fib extension from the NVDA gap day to the 3/8th high to the recent low and bounce, the 100% extension is at 459.75.
So, looking at the Q’s weekly chart also there are for now no warning signs of a pullback that is swing trading worthy.
The only warning sign is that SPY has lots of OI on the put side at the 515 level. If SPY has to go to 515, then Q’s cannot go higher.
So, the way I am looking at this setup, as long as SPY is above 520.38, I am willing to go long Q’s. But if the SPY goes below 520 then I am buying puts in SPY.
IWM:
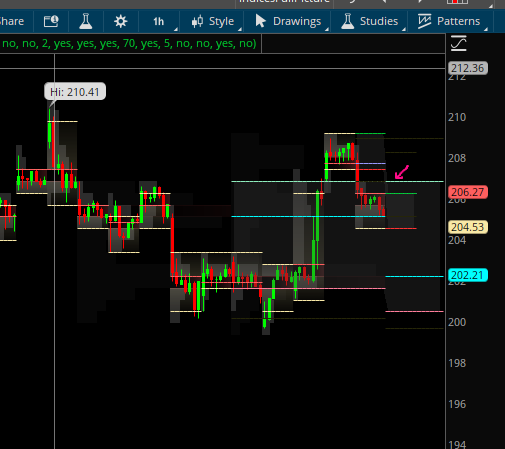
The bullish trigger for IWM is 206.84. Above 206.84 I am long IWM for the first target to 207.85, then 208.9, and then 210.41
On a swing basis, the upper target for IWM is 222 as shown

Let’s analyze the Mag-7
DIS is definitely on the radar for higher levels. So, I am watching that and looking for a 120-level
Disclaimer: This is my trading plan on the indices. This is intended to be for educational and informational purposes only. Trading is risky and loss of capital is possible. Do your due diligence. In trading, there are no guarantees. So please be careful risking capital.