

Market oversold before big earnings week
Market oversold before big earnings week

What a week we had last week!! SPX was down 6 consecutive days.
This is kind of moves don’t happen very often. Hence it is noteworthy and we need to take these moves seriously.
NVDA fell 10% on Friday. It felt like everyone wanted to get out of NVDA on Friday. Actually, on monthly options expiration Friday, when dealers have hedge outsized moves, the moves become even larger. And hence we had NVDA down so much.
So what now?
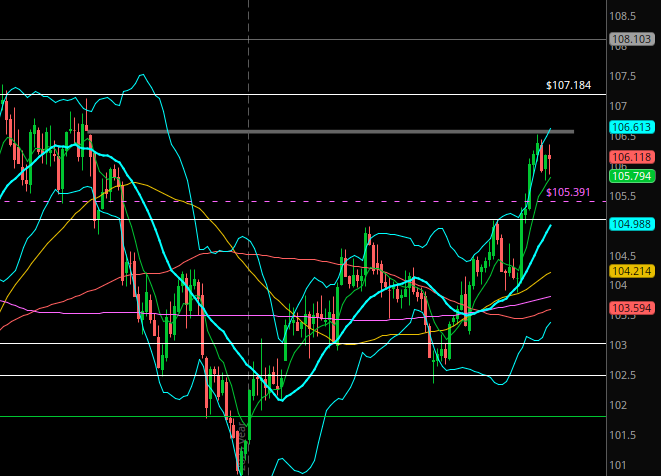
Dollar has not yet filled the gap. Last week I talked about dollar index and its gap. This week we could easily have Dollar gap up and fill this gap and then we can get some weakness in the dollar. This can bring in some buying in the indices.
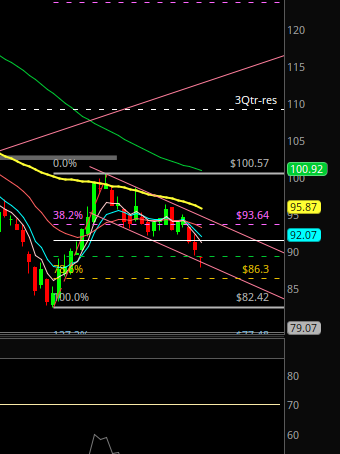
TLT : has a weekly hammer right at 61.8% fib retracement from Oct 2023 lows to the Dec 2023 highs. So, we could have ascenario such that TLT finds some buying which can be supportive to indices. And the big tech earnings also provide support to the market.
Or we could have some earnings surprise that takes the indices further into negative territory. And this panic can cause some investors to find refuge in bonds and hence we could see TLT rally.
Even though the rising dollar and rates caused this pullback in the indices, we may have the big tech earnings decide if this pullback turns into a bigger correction or we find some bounce this week due to some earnings upside suprises.
About the indices:
Friday’s sell off in the indices seemed pretty dramatic because of NVDA’s 10% fall. But the SPX stocks above their 50D MA actually rose Friday. This indicator being up actually tells us that there were many stocks that were green and got above their 50DMA. Then how was SPX down so much?

SPX is a market weighted index. So the big cap names have a higher weighting in the constiution of the index. Hence NVDA (which is almost 5% of the weighting of SPX) being down 10%, caused the market to be down more.
SPY:
The fib done from Oct 2023 lows of 409.21 to the ATH of 524.61 has its 38.2% fib retracement at 480.53 and 2021 Covid bubble highs is at 479.98. These two levels are so close that they are forming a huge confluence zone.
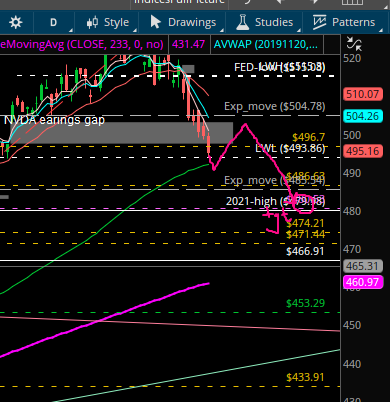
This is the possible path that SPY may take.
Disclaimer: This is my trading plan on the indices. This is intended to be for educational and informational purposes only. Trading is risky and loss of capital is possible. Do your due diligence. In trading, there are no guarantees. So please be careful risking capital.
Keep reading with a 7-day free trial
Subscribe to Index Income Trades from Archnatrades to keep reading this post and get 7 days of free access to the full post archives.