

SPY 525 resistance

Last week was eventful in the markets. We got more than a 1% down move in a day on Thursday in both SPX and Nasdaq. The implied volatility increased. The economic data that comes out shows a robust economy. Fed also talked back about the 3 rate cuts. And we had some Middle East war-related rumors. All this led to some increased volatility. Even though we lost more than 1% in the SPY and Q’s, we almost took back half of the down move on Friday.
So, are we bullish again or bearish?
Because we have not had any Middle East war rumors pan out, we are gapping up in the future. The gap up is small, giving us some clues as to the bearish sentiment.
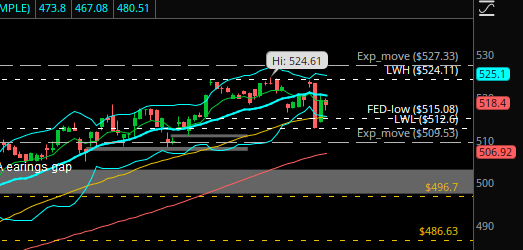
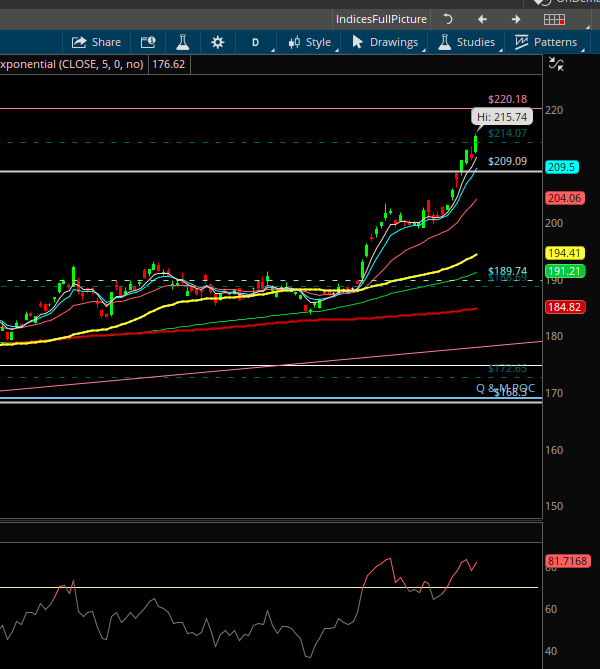
SPY: I am leaning bearish unless we can get above and stay above 521.35.
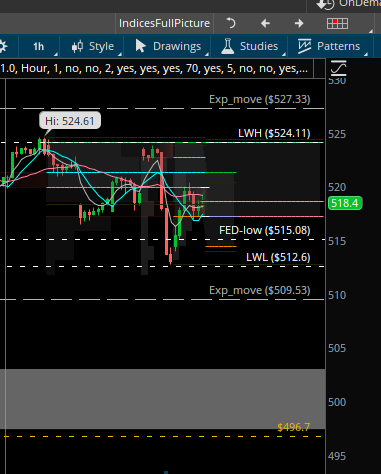
If one looks at the 4-hour chart on SPY below, one can see that 524.11 has been resistant way too many times. If SPY can regain and get over 524.11 then I do not think 527.33 which is the expected move for this coming week would be resistance. The number of times SPY has gotten whacked down from this 524 level, tells us that breaking above this would probably take SPY to 530.
Do I expect that to happen this coming week?
Based on the options positioning and charts, I would have to say a big NO.
The highest put gamma is at SPY 507 for this Friday and 523 on the call side.
Another hint that we will probably not break above the 524-525 level is the DOW Jones Industrial Average. I am looking at the DIA ETF. SPY and QQQ both are still above the 8-week moving average while DIA the large-cap blue chip company index closed below the 8-week moving average this week. This suggests further weakness to come.
Let us analyze DIA. This index ETF is giving us better clues.
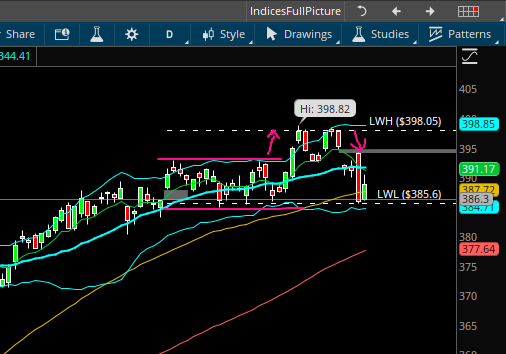
If we look at the daily chart, we had a sideways consolidation that broke out. We then had a double top. Last week we gapped down 2 days, and then on Thursday, we went higher to try and fill the gap. But failed to fill the gap by 49 cents and fell more than 1%. This setup is bearish. Any close below this 385 support level, will bring in more sellers. Based on the expected move, the support could be 382.86. But an overshoot to 378-380 on DIA for a test of 100D MA would be good before the big earnings start.
Looking at BA for a bearish play too. Just now news flash: Southwest Airlines had to make an emergency landing. BA is part of the DOW too.
Disclaimer: This is my trading plan on the indices. This is intended to be for educational and informational purposes only. Trading is risky and loss of capital is possible. Do your due diligence. In trading, there are no guarantees. So please be careful risking capital.
We have JPM and WFC bank earnings this Friday the 12th.
QQQ: DIA had its consolidation, a breakout, and is now back inside. But Q’s are still in daily consolidation. The daily chart shows the TTM squeeze while the RSI and MACD both go down. If we break below the 434-435 level on the Q’s then the expected move lower level support at 431 would bring Q’s in the gap that was created in Feb due to NVDA earnings.
Do we fill the Q’s gap that was created by NVDA earnings this coming week? I do not think so for now. But I am open to being more bearish.
Why do you say this?
AMZN and META from the Mag 7 have been rallying last week. Even NFLX and MSFT have held. GOOGLE has an AI conference this week. That should hold up GOOGL.
AAPL and TSLA have been weak. But AAPL has to break below 167.5 for a bigger flush in AAPL. A break below 167.5 and other Mag 7 components also being weak is needed for the break in Q’s. As of now 2-3 mag 7 names keep holding or breaking out.
Bitcoin the liquidity and risk indicator of mine is also in a TTM squeeze.
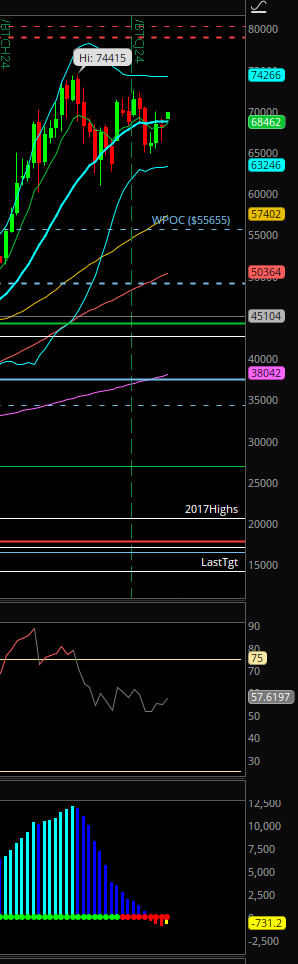
Bitcoin futures on Sunday evening opened above the mid-BB. And the momentum to the downside is fading.
As of now based on the Bitcoin futures being close to 70K, the indices may be supported. Any close below 65K in Bitcoin futures would indicate trouble not only for Bitcoin but also for the indices.
Let’s look at TLT which is the one I think caused the downmove in the indices last week.
TLT is the 10-year treasury ETF. So lower TLT means that rates are higher. And all this while the market had been rallying based on the assumption that we would have 3 rate cuts this year. This assumption is because the FED said something similar in The Dec 2023 meeting.
The market is slowing pricing in maybe 2 rate cuts this year since the economic data has been good.
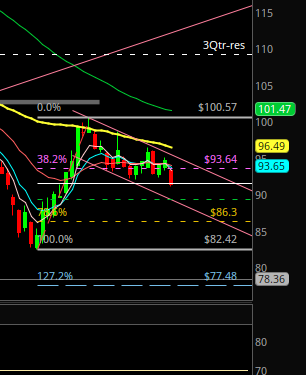
The weekly chart of the TLT shows a breakdown this past week. The 61.8% fib retracement Oct 2023 low is 89.33.
I am going to be watching what TLT does at this 89.33 level. JPM’s earnings may give us a clue as to what TLT does. And that would lead the indices to react accordingly.
GOLD: Gold has been rallying because it has sniffed FED policy favoring more growth and most likely letting inflation run higher than their target levels.
If you have to start a new position in Gold and silver then it is late. We need to wait for some kind of consolidation. The RSI on the daily GOLD chart is overbought. We
could have GLD reach the 220 fib target level and then consolidate before moving higher.
Below is the video analysis for the sector ETFs, Mag8, and some stocks that I am looking to trade for this week.
Disclaimer: This is my trading plan on the indices. This is intended to be for educational and informational purposes only. Trading is risky and loss of capital is possible. Do your due diligence. In trading, there are no guarantees. So please be careful risking capital.