


VIX expiration and FOMC on the same day!!

It is 9/15/2024!!
I am back after being absent from writing for a couple of weeks. I thought that I was providing a lot of value by posting my market thoughts and giving nice trade setups. The trade setups I posted definitely were profitable. I got disappointed when the traction I thought I should get did not match with the actual number of subscribers. For a couple of weeks, I stopped writing because I thought there was no point writing it.
So, why I am restarting to write again?
Firstly, of course writing my thoughts helped me in my trading. It helped my narrow down my focus. So, it is helpful to me.
Secondly and more importantly, my husband always tells me to focus on the good and to provide service to those who care even if it is 1 person. So, while I am disappointed that I am not having the number of subscribers I wished, I cannot be turning away from the ones that have put faith in my writing and my analysis.
So, here is to restarting the market analysis again.
Before I get to what happened last week and what can happen this coming week, I wanted to paint an overall picture.
In the beginning of August, we had a big down move because of the YEN carry trade. It happened due to the combination of falling rates here in the US anticipating that FED will be cutting and Japanese FED raising interest rates.
This pullback got bought. The violent V shaped recovery from August 5th lows suggests that investors bought this dip with both hands. All indices, all sectors were bought. From Dow Jones, to S&P to Nasdaq and even small cap index, all of the areas of the markets found buyers.
We then had some software names report that found buyers.
We also had NVDA earnings in the last week of August. We had already rallied a lot into NVDA earnings and even though the earnings were good, it was priced too perfection. And we saw NVDA not being able to gap up after earnings like it had in the previous quarters.
Now we are in the month of September, which is typically one of the weaker months of the year for the indices. Also, as the market started to focus more on employment numbers, things started to get a bit more dicey.
From end of August to 1st week of September we got S&P go from almost 5650 to 5400.
S&P came close to breaking 5400 and then would have easily headed to fill the gap to 5371. But this past week we had 5 green days and almost back to August highs in SPX and and also very close to ATH’s level.
QQQ (Nasdaq) is definitely lagging the SPX index. The small cap index is also about to breakout above the downtrend line.
But with all this sell-off and then dip buying the equity markets, the story of the last couple weeks is that GOLD is ATH’s while Bitcoin is lagging in performance.
With this gist lets look at the coming week’s calendar.

We have the monthly VIX expiration on September 18th in the morning and FOMC rate decision in the afternoon at 2pm EST.
On 20th we have the September monthly options expiration also.
We can divide the week in to 3 distinct parts.
Monday and Tuesday (pre-VIX expiration & pre-FOMC)
Wednesday VIX expiration and FOMC.
Thursday and Friday into monthly options expiration.
Monday Tuesday probably is a continuation of what happened last week. Green indices with AMZN and TSLA performing in the mag-7 complex. Plus we can have other performing stocks.
After that the path can become tricky. We could have SPX go to ATH’s after FOMC announcement. And Thursday, we could also easily gap down to create a false breakout. Under this scenario, I would expect the market to continue the pullback and if it gets serious then we could go to fill the gap at at 5370. Of course if this scenario is to play out then we are looking into October getting to this level of 5370.
Another scenario, that can play out with FOMC, is that we pullback after FOMC on Wednesday, but we get some buying back on Thrusday mainly because we going into the monthly options expiration.
The highest call gamma is at SPX 5700 and highest put gamma is at 5500. If we get below 5500 then the market can become very reflexive to the downside.
There is no analysis without charts. So, lets get to the charts:
TLT: With FOMC rate decision, TLT chart is important.

If FED cuts 50 basis point then TLT should get over 101.79. And then the TLT target going foward would be 110-112.5. Which is where I would look for a rejection and a pullback in TLT.
How long it will take TLT to go from 101.79 to 112? If it takes a quarter or so to get to 110-112 level then this would be bullish the equity markets.
If this happens faster then it would lead to a pullback in the equity markets.
SPY:

Based on September 20th options open interest, SPY 572 target is possible if markets reaction to FOMC Wednesday rate cuts is good.
The upper BB is opening up which suggests readiness of the index to move higher. So, we are looking at All-Time-Highs in SPX. The reason I am writing about a false breakout in SPX is because QQQ is lagging. So, I am looking for a breakout that gets sold.
Disclaimer: This is my trading plan on the indices. This is intended to be for educational and informational purposes only. Trading is risky and loss of capital is possible. Do your due diligence. In trading, there are no guarantees. So please be careful risking capital.
Index Income Trades from Archnatrades is a reader-supported publication. To receive new posts and support my work, consider becoming a free or paid subscriber.
QQQ: As mentioned above, QQQ is no where near ATH’s. It is still below the downtrend line. This week can let QQQ break out of this downtrend line but 490 should be resistance.

The path I think QQQ takes is marked on the chart.
DIA: The Dow Jones ETF looks even more bullish than SPY also. But it is also the closest to the 1.618 target at 420.33

So, all indices point to a pop and reject in the coming weeks.
IWM: The small cap index is the most choppy index. It has been very difficult to trade this index. Since this index is the most sensitive to rates and economic data, it is more volatile.
My preference is to trade XBI (biotech ETF) when I think IWM can rally. XBI, is holding better than IWM.
____
Bitcoin: Bitcoin is still in the downtrend channel or a big timeframe bull flag.

With FOMC, Bitcoin can get to 63K. But I am not trading Bitcoin right now. Gold is outperforming Bitcoin. So my focus has been in GLD and miners. And hence unless there is some huge directional change in Bitcoin, I am not trading it. It is right in the middle of the channel. So it can literally go in either direction.
GLD: GLD is close to reaching my long term target at GLD 245-250 level. I would be very careful to add new longs here.

I would be taking profits in Gold longs here. Of course leave a runner just in case things really want to go parabolic in it.
My way of playing Gold long is long miners like NEM. I have commons in NEM in my portfolio. So, not starting anything new here.
Out of the Mag-8 names
META, NFLX, TSLA look the most bullish.
META:
META looks more similar to SPX weekly chart. So, for this options expiration I am bullish META. If markets are going towards 5700+ in SPX, then I am looking at META getting to ATH’s too.
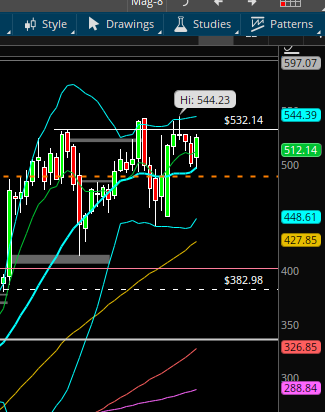
I am long a call debit spread in META.
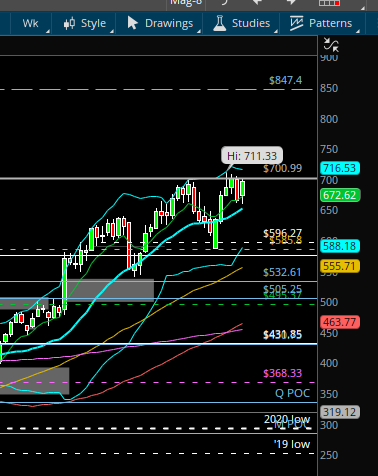
NFLX: NFLX has consolidated below 700 level for 4 weeks now. It is ready to burst above 700. If the market is going to be bullish then looking at NFLX to get above 700 and get to 720-725 level at the very least.
TSLA: TSLA broke out of the downtrend line.

Above is the weekly TSLA chart. Below is the daily chart of TSLA. The below chart shows that we have a gap to fill at 245.63
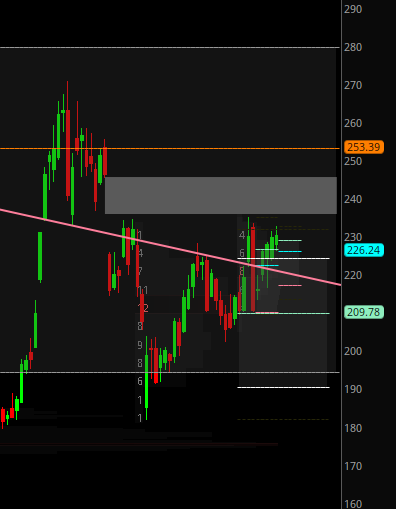
And the yearly POC is at 253 level. So we could get to 245-253 level by this options expiration.
AMZN is also bullish but is more neutral to bullish. So, it can try to break the 190 level and head higher if everything is rallying in tandem. But, AMZN is still more of a day trade type of trade for me.
The other FANG names are lagging a bit.
GOOGL is the most underperforming MAG-7 name. The antitrust and break up possibility in GOOGL, is going to be a headwind for GOOGL performance.
MSFT is the next big name that is lagging. So, if I have go short any mag-7 name as a hedge then it would be MSFT.
Everyone is talking about rate cuts being a catalyst for housing. Markets are forward looking. Hence if you are thnking of getting long some housing stocks then you are late. The move has been already happening. Even this sector was the focus in Barron’s. So, I would be very careful starting any new long in housing sector.
I am already long META, TSLA and AMZN going into this week. I am now looking to add some hedges. But these hedges are only hedges. I would like to take some put debit spreads for Feb 2025 expiration. This would cover any bad economic data that markets reacts to, and/or election surprises that market reacts to.
I will post some trade ideas and setups more often.
I would like to request some feedback from my readers. I would like feedback as to what you guys expect to see from these posts. I hope to make it better as I work on t he feedback I get.
Disclaimer: This is my trading plan on the indices. This is intended to be for educational and informational purposes only. Trading is risky and loss of capital is possible. Do your due diligence. In trading, there are no guarantees. So please be careful risking capital.
Index Income Trades from Archnatrades is a reader-supported publication. To receive new posts and support my work, consider becoming a free or paid subscriber.